
An analysis of individual voting precincts* within or overlapping the City of Pearland’s boundaries shows an electorate that favored Democratic candidates overall in the November 3, 2026 election, while giving Republicans stronger results in county races than in several prominent statewide contests.
Nearly 68,000 ballots cast
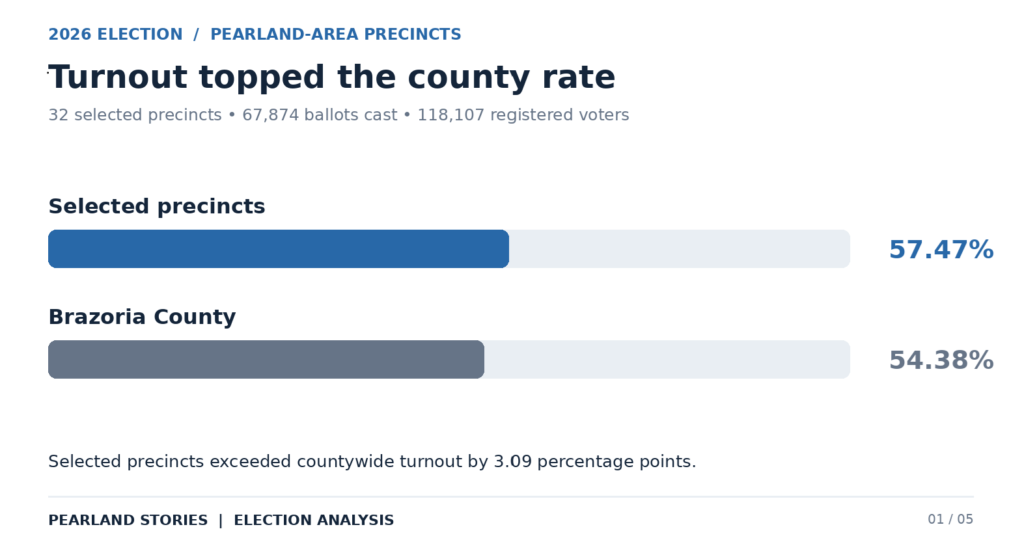
The 32 precincts recorded 67,874 ballots cast among 118,107 registered voters, producing a combined turnout rate of 57.47%.
That exceeded the 54.38% countywide turnout listed in the county reports by approximately 3.09 percentage points. The combined rate reflects total ballots divided by total registered voters, rather than an average of the individual precinct percentages.
The central finding is variation. Democratic candidates led the combined vote in every contested partisan race represented in the results, but the size of that advantage changed substantially by office and precinct.
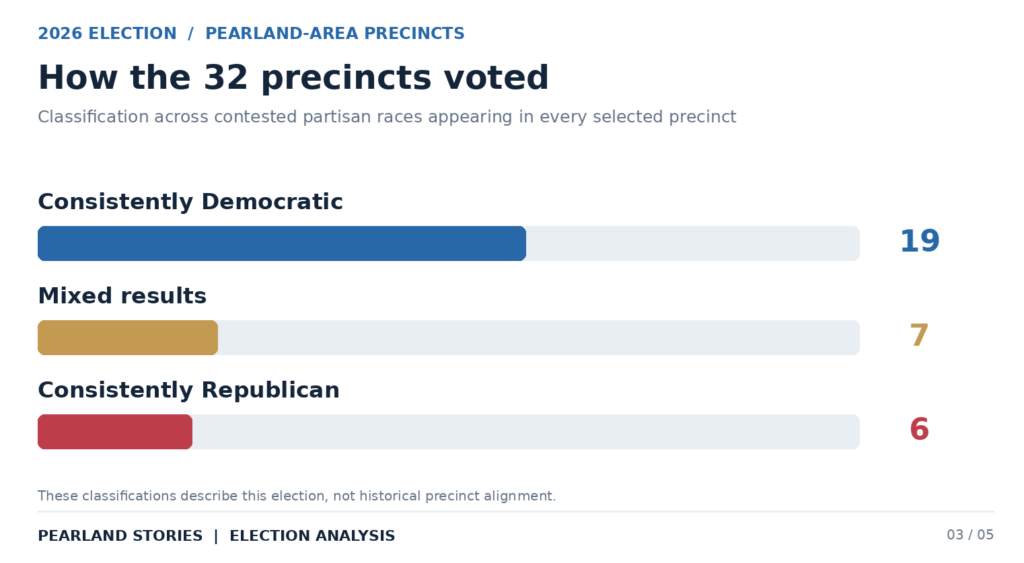
Nineteen precincts consistently favored Democrats across contested partisan races appearing in all 32 precincts. Six consistently favored Republicans. Seven produced mixed partisan results depending on the race. Those classifications describe this election, not a historical designation of the precincts.
Talarico posted the strongest result among principal Democratic candidates
James Talarico received 41,310 votes in the U.S. Senate race, compared with 25,065 for Republican Ken Paxton.
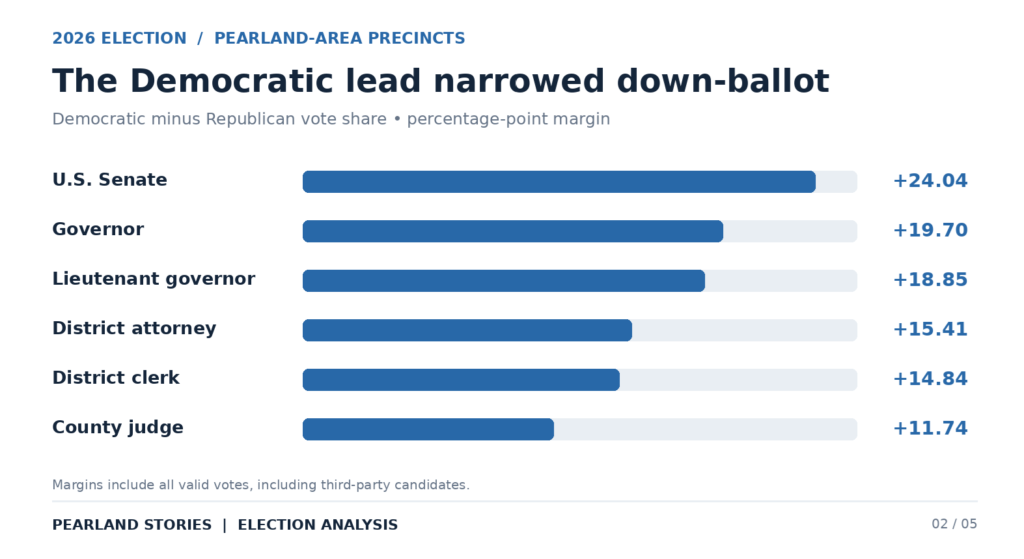
Talarico’s 61.14% share of all valid votes gave him a 16,245-vote advantage and a 24.04-percentage-point lead over Paxton. He carried 26 of the 32 precincts.
Democratic gubernatorial candidate Gina Hinojosa received 39,918 votes to Republican Greg Abbott’s 26,602. Hinojosa’s 59.05% share gave her a 13,316-vote advantage and a 19.70-point lead. She carried 24 precincts.
Talarico received 1,392 more votes than Hinojosa and 2,989 more than Democratic district attorney candidate Bianca Santorini. On the Republican side,
Paxton received 3,021 fewer votes than district attorney candidate Tom Selleck and 3,035 fewer than district clerk candidate Cassandra Tigner.
Those differences show candidate-level variation within an electorate that generally favored Democrats. They do not establish that those exact voters switched parties between races. Precinct totals cannot distinguish individual ticket splitting from differences in race participation or support for other candidates.
Democrats led the principal statewide contests
Beyond Senate and governor, the selected precincts favored Democratic candidates across the principal statewide executive races.
For lieutenant governor, Vikki Goodwin received 39,109 votes to Dan Patrick’s 26,428. Goodwin received 58.13% of valid votes and led Patrick by 18.85 percentage points.
For attorney general, Nathan Johnson received 39,218 votes to Mayes Middleton’s 26,866. Johnson’s share was 58.35%, with an 18.38-point lead.
For comptroller, Sarah Eckhardt received 38,353 votes to Don Huffines’ 26,942. Eckhardt received 57.26% and led by 17.04 points.
For land commissioner, Benjamin Flores received 38,454 votes to Dawn Buckingham’s 27,329. Flores received 57.49% and led by 16.63 points.
For agriculture commissioner, Clayton Tucker received 38,273 votes to Nate Sheets’ 27,185. Tucker received 57.29% and led by 16.60 points.
For railroad commissioner, Jon Rosenthal received 39,159 votes to Bo French’s 26,420. Rosenthal received 58.67% and led by 19.09 points.
These shares include all valid votes in each contest, including votes for third-party and write-in candidates. A percentage-point margin is the difference between the Democratic and Republican candidates’ shares, not the percentage of voters who changed their preferences.
Republicans were more competitive in county races
Democrats also led the contested countywide races in the combined precinct set, but generally by smaller margins than in the Senate and governor’s contests.
For district attorney, Bianca Santorini received 38,321 votes to Tom Selleck’s 28,086. Santorini received 57.71% of valid votes and led by 15.41 percentage points.
For County Court at Law No. 2, Matt Muller received 37,953 votes to Thomas L. Pfeiffer’s 27,947. Muller received 57.59% and led by 15.18 points.
For district clerk, Grandison Porter received 37,894 votes to Cassandra Tigner’s 28,100. Porter received 57.42% and led by 14.84 points.
For county clerk, Adrienne Bell received 38,594 votes to Joyce Hudman’s 27,502. Bell received 58.39% and led by 16.78 points.
For county treasurer, Steve Sanders received 38,162 votes to Angela Dees’ 27,866. Sanders received 57.80% and led by 15.59 points.
Most contested countywide races produced 19 or 20 Democratic precinct wins, compared with Talarico’s 26 and Hinojosa’s 24. The broader pattern was a Democratic advantage that narrowed farther down the ballot.
Independent candidacy distinguished the county judge race
The county judge contest produced a different distribution because it included an independent candidate with substantial support.
Democrat Eugene Howard received 34,773 votes, or 52.39%. Republican Rob Giesecke received 26,978 votes, or 40.65%. Independent Lucinda Henry received 4,618 votes, or 6.96%.
Howard led Giesecke by 7,795 votes and 11.74 percentage points within the selected precincts.
Howard’s share was approximately six percentage points below Bell’s share in the county clerk race. Giesecke’s share was also below Hudman’s. Henry’s candidacy is therefore an important part of understanding why the county judge result differed from other county contests.
The results do not establish whether Henry drew more support from voters who otherwise would have chosen Howard or Giesecke. Assigning those votes to either candidate would require evidence beyond precinct totals.
Nineteen precincts consistently favored Democrats
Across contested partisan races appearing in all 32 precincts, Democratic candidates consistently led in precincts 26, 29, 41, 44, 50, 53, 54, 59, 60, 62, 64, 65, 66, 67, 68, 69, 70, 71 and 72.
Republican candidates consistently led in precincts 18, 39, 46, 51, 52 and 61.
Precincts 12, 13, 27, 28, 36, 37 and 47 produced mixed results.
Precinct 50 recorded the largest Democratic Senate margin. Talarico received 1,570 votes to Paxton’s 313, a 1,257-vote advantage and a 65.6-percentage-point margin. Precincts 53, 67 and 68 also gave Talarico margins exceeding 61 points.
Precinct 61 produced the largest Republican Senate margin, 33.4 points, but cast only 719 ballots overall. Precinct 51 combined a substantial Republican margin with greater ballot volume: Paxton received 1,326 votes to Talarico’s 752, a 574-vote advantage.
That distinction matters. A precinct’s percentage margin measures the strength of its preference, while its raw vote margin measures its contribution to the combined result.
On the Democratic side, precinct 68 contributed a 1,775-vote Senate advantage, and precinct 66 contributed 1,569.
Seven precincts reveal candidate-sensitive voting
The seven mixed-result precincts provide some of the clearest evidence that voters did not respond identically to every race.
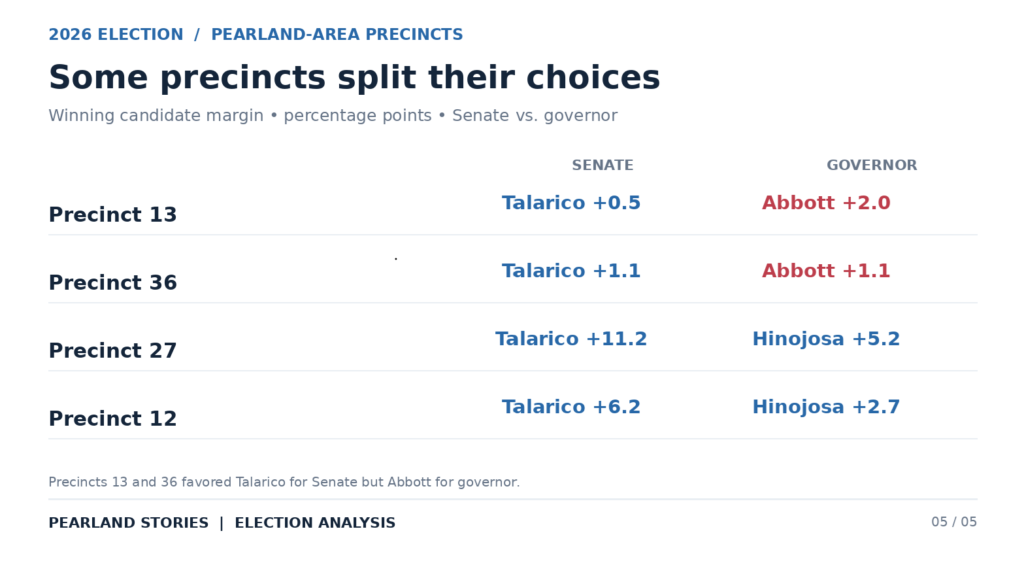
In precinct 13, Talarico won by nine votes, 896 to 887. Abbott nevertheless led the governor’s race by 37 votes, 912 to 875.
In precinct 36, Talarico won by 13 votes, 563 to 550. Abbott led by 12 votes, 564 to 552.
Those were close precincts, rather than strong Democratic precincts simply because Talarico finished first.
Precincts 12, 28, 37 and 47 favored Talarico and Hinojosa but favored Giesecke for county judge and Hudman for county clerk.
Precinct 12 illustrates the difference. Talarico led by 131 votes and Hinojosa by 57, but Giesecke led Howard by 143 votes and Hudman led Bell by 65.
Precinct 27 was especially sensitive to the contest. Talarico led by 11.2 percentage points and Hinojosa by 5.2 points. Giesecke nevertheless led Howard by 5.3 points, while Bell narrowly led Hudman. The district clerk race finished tied at 750 votes apiece.
Precinct 27 also recorded the highest turnout rate in the selected set.12.
Turnout and margins in every selected precinct
The following precinct summaries pair turnout with three revealing races: U.S. Senate, governor and county judge. Margins are rounded to one decimal place and calculated using all valid votes in the relevant contest.
Additional Insights
• Precinct 12: Turnout was 53.8%. Talarico led by 6.2 points, Hinojosa by 2.7 points and Giesecke by 6.8 points.
• Precinct 13: Turnout was 58.7%. Talarico led by 0.5 points, Abbott by 2.0 points and Giesecke by 9.3 points.
• Precinct 18: Turnout was 61.1%. Paxton led by 15.4 points, Abbott by 17.9 points and Giesecke by 26.5 points.
• Precinct 26: Turnout was 54.3%. Talarico led by 15.1 points, Hinojosa by 11.9 points and Howard by 3.8 points.
• Precinct 27: Turnout was 67.2%. Talarico led by 11.2 points, Hinojosa by 5.2 points and Giesecke by 5.3 points.
• Precinct 28: Turnout was 61.0%. Talarico led by 6.2 points, Hinojosa by 1.6 points and Giesecke by 7.9 points.
• Precinct 29: Turnout was 58.1%. Talarico led by 38.2 points, Hinojosa by 33.3 points and Howard by 26.4 points.12.
• Precinct 36: Turnout was 43.0%. Talarico led by 1.1 points, Abbott by 1.1 points and Giesecke by 5.9 points.
• Precinct 37: Turnout was 57.9%. Talarico led by 6.3 points, Hinojosa by 1.8 points and Giesecke by 7.7 points.
• Precinct 39: Turnout was 45.8%. Paxton led by 7.3 points, Abbott by 11.5 points and Giesecke by 17.6 points.
• Precinct 41: Turnout was 62.1%. Talarico led by 33.4 points, Hinojosa by 27.3 points and Howard by 17.9 points.
• Precinct 44: Turnout was 58.0%. Talarico led by 36.5 points, Hinojosa by 31.4 points and Howard by 22.3 points.
• Precinct 46: Turnout was 57.3%. Paxton led by 4.8 points, Abbott by 8.3 points and Giesecke by 15.6 points.
• Precinct 47: Turnout was 52.6%. Talarico led by 6.6 points, Hinojosa by 2.1 points and Giesecke by 7.4 points.
• Precinct 50: Turnout was 52.9%. Talarico led by 65.6 points, Hinojosa by 61.5 points and Howard by 53.4 points.
• Precinct 51: Turnout was 61.8%. Paxton led by 27.2 points, Abbott by 30.6 points and Giesecke by 36.5 points.
• Precinct 52: Turnout was 57.8%. Paxton led by 15.4 points, Abbott by 19.9 points and Giesecke by 29.5 points.
• Precinct 53: Turnout was 56.0%. Talarico led by 61.7 points, Hinojosa by 58.2 points and Howard by 53.1 points.
• Precinct 54: Turnout was 60.2%. Talarico led by 43.4 points, Hinojosa by 39.8 points and Howard by 30.0 points.
• Precinct 59: Turnout was 62.6%. Talarico led by 49.5 points, Hinojosa by 43.7 points and Howard by 37.3 points.
• Precinct 60: Turnout was 58.3%. Talarico led by 22.0 points, Hinojosa by 15.8 points and Howard by 5.7 points.
• Precinct 61: Turnout was 50.2%. Paxton led by 33.4 points, Abbott by 35.5 points and Giesecke by 41.0 points.
• Precinct 62: Turnout was 54.6%. Talarico led by 27.1 points, Hinojosa by 23.0 points and Howard by 15.5 points.
• Precinct 64: Turnout was 41.9%. Talarico led by 42.4 points, Hinojosa by 40.6 points and Howard by 31.8 points.
• Precinct 65: Turnout was 60.8%. Talarico led by 20.5 points, Hinojosa by 17.5 points and Howard by 10.7 points.
• Precinct 66: Turnout was 61.5%. Talarico led by 51.1 points, Hinojosa by 45.6 points and Howard by 37.1 points.
• Precinct 67: Turnout was 51.6%. Talarico led by 61.5 points, Hinojosa by 57.3 points and Howard by 50.3 points.
• Precinct 68: Turnout was 60.9%. Talarico led by 61.5 points, Hinojosa by 57.0 points and Howard by 50.4 points.
• Precinct 69: Turnout was 63.2%. Talarico led by 52.4 points, Hinojosa by 45.8 points and Howard by 39.7 points.
• Precinct 70: Turnout was 61.5%. Talarico led by 49.3 points, Hinojosa by 43.6 points and Howard by 35.3 points.
• Precinct 71: Turnout was 58.3%. Talarico led by 41.5 points, Hinojosa by 39.4 points and Howard by 33.6 points.
• Precinct 72: Turnout was 57.8%. Talarico led by 48.5 points, Hinojosa by 42.5 points and Howard by 34.4 points.
Precinct 27 led turnout, while precinct 65 cast the most ballots
Precinct 27 had the highest participation rate, with 1,541 of its 2,293 registered voters casting ballots, or 67.20%.
The next-highest turnout rates were:
• Precinct 69: 63.23%, with 1,689 ballots among 2,671 registered voters.
• Precinct 59: 62.58%, with 1,759 ballots among 2,811 registered voters.
• Precinct 41: 62.07%, with 3,082 ballots among 4,965 registered voters.
• Precinct 51: 61.76%, with 2,117 ballots among 3,428 registered voters.
• Precinct 70: 61.53%, with 2,917 ballots among 4,741 registered voters.
• Precinct 66: 61.52%, with 3,077 ballots among 5,002 registered voters.
• Precinct 18: 61.14%, with 2,996 ballots among 4,900 registered voters.
• Precinct 28: 60.96%, with 2,712 ballots among 4,449 registered voters.
• Precinct 68: 60.92%, with 2,896 ballots among 4,754 registered voters.
Precinct 65 contributed the most ballots overall, 3,116, despite ranking below those precincts in turnout rate. Its participation rate was 60.80%.
Precincts 41 and 66 followed in ballot volume, with 3,082 and 3,077 ballots, respectively. A high participation rate and a large contribution to the overall vote are related but separate measures.27.
District races reflected different groups of voters
Congressional, legislative, commissioner and justice of the peace races appeared in different subsets of the 32 precincts. Their results describe those subsets, not identical electorates or the complete districts.
In the 15 precincts voting in U.S. House District 14, Democrat Thurman Bill Bartie received 16,905 votes to Republican Randy Weber’s 15,015. Bartie received 52.96%.
In the 17 precincts voting in U.S. House District 36, Democrat Rhonda Hart received 22,449 votes to Republican Brian Babin’s 12,621. Hart received 64.01%.
In the nine precincts voting in Texas House District 25, Democrat Mike Meadors received 13,592 votes to Republican Cody Thane Vasut’s 4,539. Meadors received 74.97%.
In the 23 selected precincts voting in Texas House District 29, Democrat Karen Reeder received 25,309 votes to Republican Jeff Barry’s 23,130. Reeder received 52.25%.
Those differences cannot be attributed solely to candidate appeal. Talarico received 76.61% in the same nine District 25 precincts, compared with 55.34% in the 23 District 29 precincts. The two groups of precincts already differed substantially in their Senate preferences. Both Democratic state House candidates ran below Talarico’s share in their respective subsets.
For county commissioner Precinct 2, Democrat Carlos Townsend, Sr. received 10,699 votes to Republican Alfred Froberg’s 8,147 in the eight selected precincts participating in that contest. Townsend received 56.77%.
For county commissioner Precinct 4, Democrat Becky Singleton received 10,080 votes to Republican David Linder’s 3,590 in seven selected precincts. Singleton received 73.74%.
For justice of the peace Precinct 2, Place 2, Democrat Shenequa Harrison received 10,803 votes to Republican Richard B. Davis’ 7,988 in eight selected precincts. Harrison received 57.49%.
For justice of the peace Precinct 3, Place 2, Democrat Mark Wright received 17,128 votes to Republican Jon Albin’s 16,378 in 17 selected precincts. Wright received 51.12%.
For justice of the peace Precinct 4, Place 2, Democrat Stephanie Baird received 10,146 votes to Republican Blaine Chesser’s 3,497 in seven selected precincts. Baird received 74.37%.
Judicial contests followed the broader partisan pattern
Democratic candidates led the combined selected-precinct vote in every contested judicial race.
Among the statewide Supreme Court and Court of Criminal Appeals contests, Democratic margins ranged from 13.75 percentage points for Okey Anyiam to 17.40 points for Kristen Hawkins. Regional appellate races generally produced Democratic margins of approximately 15 to 17 points.
Those results were closer to the contested county races than to Talarico’s 24-point Senate advantage.
Uncontested Republican judicial races require a different interpretation. A candidate receiving 100% of the valid votes in an uncontested contest does not mean every voter supported that candidate or party. Many voters left those races blank, and no Democratic opponent was available for comparison.
Nonpartisan director contests drew fewer votes
The precinct reports also included three nonpartisan races for “Director, Position 1,” “Director, Position 2” and “Director, Position 3.”
For Position 1, Lois Liles McKibben received 27,768 votes, or 61.22%, to Konstantinos Vogiatzis’ 17,587.
For Position 2, Brooks Mooney received 18,757 votes, or 41.40%. Joe Stinebaker received 17,103, or 37.75%, and Yusef J. Burgess received 9,442, or 20.84%.
For Position 3, Elizabeth Day received 26,030 votes, or 58.07%, to Benjamin Kitchens’ 18,798.
McKibben and Day led in all 32 precincts. Mooney led in 22 precincts and Stinebaker in 10.
These contests recorded approximately 44,800 to 45,400 valid candidate votes, compared with 67,874 ballots cast overall. Roughly one-third of ballots did not register a valid candidate vote in each director contest.
That is substantial down-ballot nonparticipation. The precinct reports do not explain why voters skipped those contests, and the candidates should not be assigned party affiliations based solely on the precincts where they performed well.
Early voters favored Democrats more heavily than Election Day voters
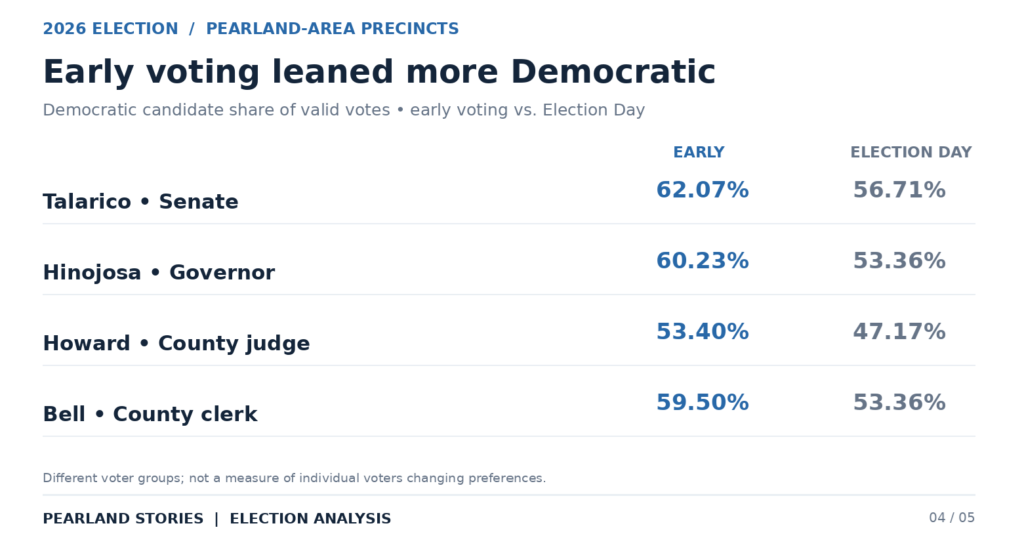
Democratic candidates generally received higher shares among early voters than among Election Day voters.
Talarico received 62.07% of the early vote, compared with 56.71% on Election Day.
Hinojosa received 60.23% of the early vote, compared with 53.36% on Election Day.
Howard received 53.40% of the early vote, compared with 47.17% on Election Day.
Bell received 59.50% of the early vote, compared with 53.36% on Election Day.
Those percentages include all valid votes cast through each method in the relevant race. They compare different groups of voters, not changes in the preferences of the same people over the voting period.
One election shows differences, not a historical shift
The precinct results establish a Democratic advantage across the selected Pearland-area electorate, alongside substantial Republican strength in particular precincts and stronger Republican performance in county contests than in the Senate race.
They also show that the most politically competitive precincts were not interchangeable. Some narrowly favored Talarico but Abbott. Others favored Democrats for Senate and governor but Republicans for county offices. Precinct 27 combined the highest turnout rate with results that varied sharply by contest.
What these results do not establish is movement over time. Without comparable earlier results, they cannot support a claim that Pearland “turned blue,” “shifted left,” or became more Republican or Democratic than before.
The supported conclusion is narrower: in this November 2026 precinct set, Democrats led overall, but candidate choice, ballot position, precinct composition and participation produced meaningfully different results from race to race.
—–
*Note: This analysis includes Brazoria County voting precincts 12, 13, 18, 26, 27, 28, 29, 36, 37, 39, 41, 44, 46, 47, 50, 51, 52, 53, 54, 59, 60, 61, 62, 64, 65, 66, 67, 68, 69, 70, 71 and 72. These are voting precincts within or overlapping the City of Pearland’s boundaries
These are whole-precinct results for the selected Pearland-area precincts, not a voter-by-voter accounting restricted to municipal boundaries. Where a precinct extends outside Pearland, its results include those voters. The analysis also does not include Pearland voters in other counties. The figures should therefore be understood as results from this specific 32-precinct set, rather than a certified citywide total.
These precinct reports from the county are labeled unofficial results. A candidate leading this selected set did not necessarily win the full county, congressional district, legislative district or state.
The data came from precinct-specific election results from Brazoria County available at:
https://www.brazoriacountyclerktx.gov/departments/elections/election-results
https://www.brazoriacountyclerktx.gov/home/showpublisheddocument/34166/639293456109591719
See precinct maps at:
https://www.brazoriacountyclerktx.gov/departments/elections/precinct-maps